User Tools
Site Tools
Sidebar
Deliverables management levels
Deliverables management
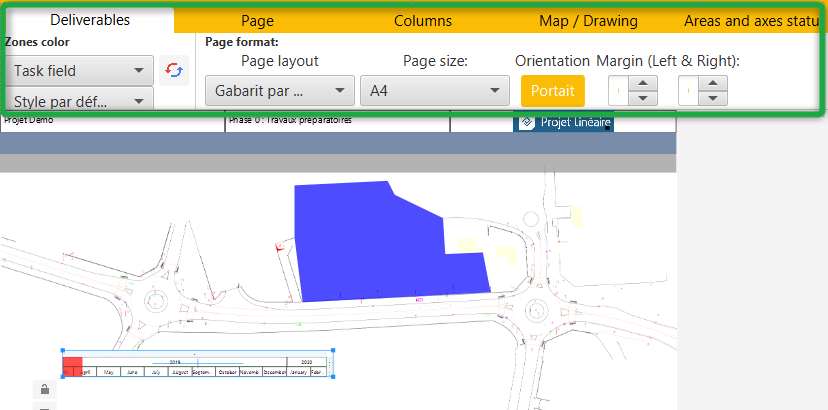
The deliverable management interface has evolved in version 4, with four levels of parameterization:
- Deliverables
- Page
- Columns
- Map / Drawing
A fifth tab allows you to set colors for the status of areas and axes.

Deliverables
This tab allows you to set for the whole deliverable:
Areas color
The color applie to areas and axes:
- Status color: defined in the “Areas and axes status” tab
- Area/Axis color: defined in the Create phasing interface
- Task field: based on custom fields
Page format
- Page layout used: including columns
- Page size: A0 → A5
- Orientation and margins
Page
This tab allows you to define page by page :
- Printing area used
- Zoom level applied (on display)
- Options: if you want to display chart legends (Gantt, Time line…) and KPs
- Labels:
- model and size of lables
- automatic placement tool
- option: if you wish to display them and their links
Columns
This tab allows you to insert Objects, Tasks fields and Legends. It also allows you to decide if you want to display the Scale if it exists.
Objects
Allows you to insert shapes, polylines, polygons, texts or images.
Tasks fields
Allows you to insert the name of the phase, as well as the start and end dates of the page.
Chart legends
Allows you to insert :
- Status legend
- Areas legend
- Time scale
- Gantt chart
Map / Drawing
Allows you to insert Objects as for the columns, but directly on the drawing.
It is from this tab that you can also add a dimension with the measurement tool.


